Technology
Travera’s Clinical Platform & Workflow
Assessing Each Patient’s Personalized Response to Cancer Drugs
The testing process begins the moment our lab receives cancer cells from the patient. Cancer cells are collected by clinicians and shipped overnight to our lab in one of our temperature-controlled shipping kits. Our test process incorporates five basic steps.

1
Purifying The Cells
As soon as we receive the biopsy sample, we begin a purification process to isolate the cancer cells for testing. For blood cancers, we use a positive selection method that identifies and isolates the cancer cells based on known proteins on the cancer cell membranes. For solid tumors, we dissociate the tissue into a single cell suspension and use a negative selection method that destroys the non-cancerous cells, resulting in a high concentration of cancer cells suitable for testing.

2
Dosing And Incubating The Cells
A portion of the purified cells is used for assessing drug effectiveness and another portion is used as controls. Each sample is divided into multiple wells, with a single drug or drug combination added to the test wells and no drug added to the control wells. We incubate the samples for approximately 15 hours.
The cancer cells that receive cytotoxic drugs (such as chemotherapies and targeted inhibitors) are incubated in minimal media only. For immunotherapies (antibodies and checkpoint inhibitors) we include the immune system components (NK cells, T cells, and complementary proteins) required to enable the anti-cancer activity of the drug.

3
Measuring Mass Distribution
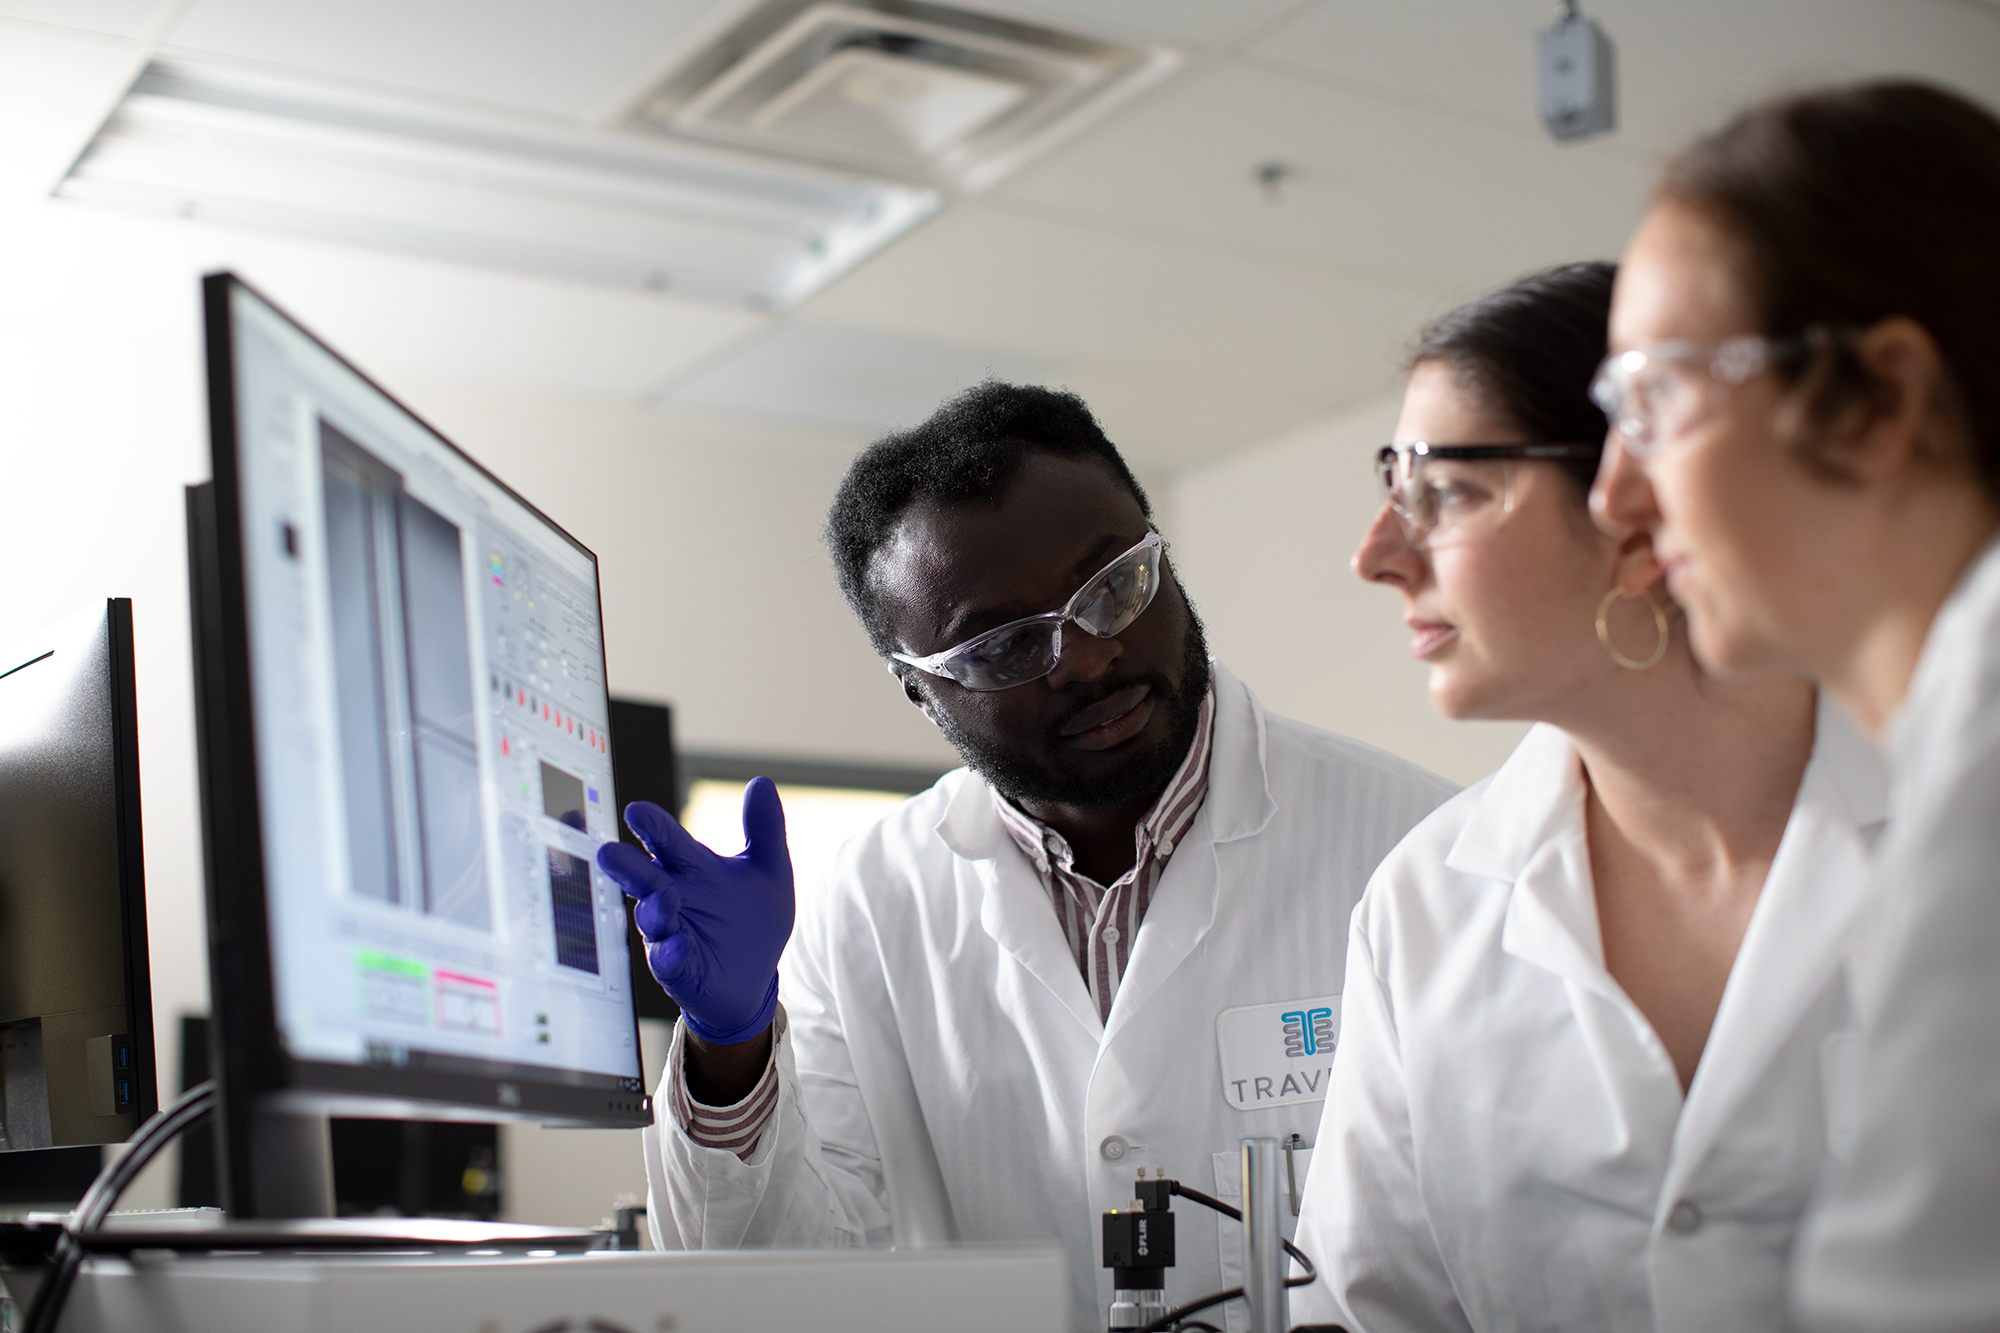
Immediately following the incubation period, we measure the mass distributions of the cells from each well using our proprietary Suspended Microchannel Resonator (SMR).
Since the cell purification process leaves impurities that can interfere with our mass distribution measurements, we use an AI-based image classification system to identify and remove impurities before doing our calculations. We produce a brightfield image of each particle entering the SMR, link the image to the mass measurement, and use a manually curated training set of approximately 20,000 images of healthy cells, dead cells, debris, and clusters to automatically classify each particle. This enables us to remove the debris and clusters from the calculation of the mass distributions.
4
Calculating Drug Response
Once we have measured the masses of the cells in all the wells, we compare the difference in the mass distributions of the cells exposed to drugs to the cells in the control group and calculate whether the measurements are significantly different. We use the p-value as the standard measure of statistical confidence. We convert p-values to a score of 0-100, where scores less than 50 correspond to “no drug response” from resistant cells, and scores greater than or equal to 50 correspond to “positive drug response” from sensitive cells.

5
Reporting Results
We generate a report that includes drug sensitivity information along with a variety of quality control and other measurements we make during the process. We submit this report to the ordering physician the day after we receive the sample.
Additional information:
How it works for Patients & Caregivers
How it works for Healthcare Professionals